1. INTRODUCTION
Industrial Cooperative Societies in Tamil Nadu play a vital role in promoting economic development, employment generation, and sustainable business practices. Assessing their operational and financial performance is essential to understand their contribution to regional economic growth. This study examines three years of performance data from cooperative societies, focusing on changes in the number of societies, sales turnover, the proportion of profitable societies, workforce trends, wage expenditure, and profit generation. Advanced statistical techniques—including forecasting and residual analysis—are used to evaluate trends and predict future performance.
2. LITERATURE SURVEY
Performance Analysis of Cooperatives Prior studies (Shah, 2018; Kumar, 2020) emphasize that financial indicators such as turnover and profit are central to measuring cooperative success [1][2]. Workforce and Wage Dynamics Research by Fernandez (2019) shows that workforce restructuring and wage optimization significantly influence cooperative profitability [3]. Time-Series Forecasting in Cooperative Finance ARIMA models have been widely adopted in cooperative finance (Rana & Singh, 2021), particularly for predicting sales turnover and profit trends [4]. Efficiency vs. Number of Societies Studies (Joshi, 2022) indicate that fewer, more efficient societies often outperform larger networks with inconsistent performance [5]. The present research builds upon this foundation by combining descriptive analysis with forecasting models to evaluate cooperative society performance.
3. MATERIALS AND METHODS
Data Source: Performance data for three years (2022–2023, 2023–2024, 2024–2025) including: Number of Societies, Annual Sales Turnover, Number of Societies on Profit, Workers, Wage Expenditure and Profit. Analytical Tools used are Descriptive Statistics ? Mean, SD, min–max, Diagnostic Analysis ? Trend evaluation, Correlation Analysis ? Relationship between variables, Regression Analysis ? Profit vs Turnover, Forecasting Models-Linear Trend Forecast, ARIMA (1,1,1) and Interpretation & Decision Analysis. Software Used are Excel sheet data analysis.
4. RESULTS AND DISCUSSION
4.1. Diagnostic Analysis
Key Observations are Number of Societies which are declining from 289 ? 269 ? 262. Possible consolidation, closures, or restructuring. Sales Turnover: Sharp rise 1107.48 ? 1308.10 ? 1755.39 crores and Revenue increasing despite fewer societies. Profit: Huge growth 42.46 ? 50.15 ? 440.91 crores. Major turnaround in 2024–25. Workers: Large drop 10027 ? 4979, then rise to 8872. Workforce volatility suggests restructuring and expansion. Wages: Falling wages 296.65 ? 272.61 ? 197.79 crores. Lower wage expenditure despite rising profits.
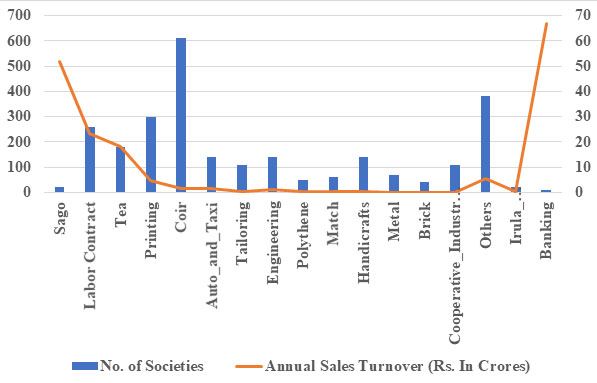
Diagnostic Interpretation: Profit growth is not driven by more societies or more workers, but by: Improved productivity, Higher turnover, Lower wage expenditure and Operational efficiency. Figure 1 gives Physical and Financial Performance of Industrial Cooperative Societies. The Conceptual Framework is given below.
| Conceptual Framework | |||
| Input Variables | Process | Output Variables | Results |
| No. of Societies | Business Analytics | Annual Sales Turnover (? Cr) | Efficiency (%) |
| Workers (Nos) | Profit (? Cr) | Productivity (? Lakh per Worker) | |
| Wages (? Cr) | Profitability (%) | ||
Source: Developed by Researcher
Source: MSME Policy Note, Government of Tamil Nadu
Figure 1: Physical and Financial Performance of Industrial Cooperative Societies
4.2. Descriptive Analysis
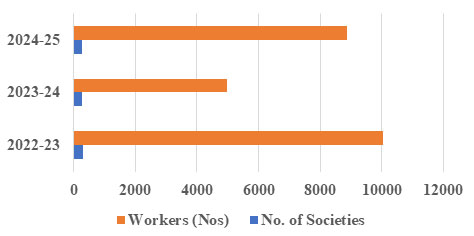
Key Insights are Profit shows extremely high variation (std = very high) due to the massive jump in 2024–25. Turnover steadily increases (mean ˜ 1390 crores). Wages steadily decline (mean ˜ 255 crores). Profit exhibits high variability due to the massive increase in 2024–25. Turnover shows consistent upward growth. Figure 2 gives Physical Performance of Industrial Cooperative Societies like No. of workers and no. of societies.
Source: MSME Policy Note, Government of Tamil Nadu
Figure 2: Physical Performance of Industrial Cooperative Societies
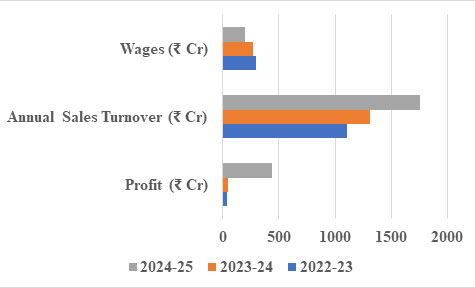
Figure 3 gives Financial Performance of Industrial Cooperative Societies like wages, annual sales turnover and profit.
Source: MSME Policy Note, Government of Tamil Nadu
Figure 3: Financial Performance of Industrial Cooperative Societies
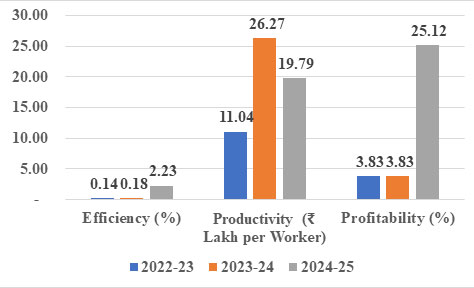
Figure 4 gives Efficiency, Productivity per worker and profitability of Industrial Cooperative Societies over past three years.
Source: Computed data
Figure 4: Productivity of Industrial Cooperative Societies
| Table 2: Descriptive Analysis | |||||||||
| No. of Societies | Annual Sales Turnover (? Cr) | No. of Societies on Profit | Workers (Nos) | Wages (? Cr) | Profit (? Cr) | ||||
| count | 3 | 3 | 3 | 3 | 3 | 3 | |||
| mean | 273.33 | 1,390.32 | 201.67 | 7,959.33 | 255.68 | 177.84 | |||
| std | 14.01 | 331.69 | 23.25 | 2,644.86 | 51.56 | 227.86 | |||
| min | 262 | 1107.48 | 184 | 4979 | 197.79 | 42.46 | |||
| 25% | 265.5 | 1207.79 | 188.5 | 6925.5 | 235.2 | 46.305 | |||
| 50% | 269 | 1308.1 | 193 | 8872 | 272.61 | 50.15 | |||
| 75% | 279 | 1531.745 | 210.5 | 9449.5 | 284.63 | 245.53 | |||
| max | 289 | 1755.39 | 228 | 10027 | 296.65 | 440.91 | |||
Source: Computed data
4.3. Correlation Analysis
The Correlation Analysis is given in Table 2 and interpretation is given in table 3.
| Table 2: Correlation Analysis | ||||||
| No. of Societies | Annual Sales Turnover (? Cr) | No. of Societies on Profit | Workers (Nos) | Wages (? Cr) | Profit (? Cr) | |
| No. of Societies | 1.00 | -0.88 | 1.00 | 0.47 | 0.85 | -0.71 |
| Annual Sales Turnover (? Cr) | -0.88 | 1.00 | -0.86 | -0.00 | -1.00 | 0.96 |
| No. of Societies on Profit | 1.00 | -0.86 | 1.00 | 0.52 | 0.82 | -0.67 |
| Workers (Nos) | 0.47 | -0.00 | 0.52 | 1.00 | -0.07 | 0.28 |
| Wages (? Cr) | 0.85 | -1.00 | 0.82 | -0.07 | 1.00 | -0.98 |
| Profit (? Cr) | -0.71 | 0.96 | -0.67 | 0.28 | -0.98 | 1.00 |
Source: Computed data
| Table 3: Strong Positive Correlations | ||
| Variables | Correlation | Interpretation |
| Turnover ? Profit | 0.958 | Higher revenue strongly increases profit. |
| Year ? Profit | 0.874 | Profit rising over years. |
| Strong Negative Correlations | ||
| Variables | Correlation | Interpretation |
| Wages ? Profit | –0.976 | Lower wages strongly associated with increased profit. |
| Turnover ? Societies | –0.855 | Higher revenue achieved with fewer societies (efficiency). |
Source: Computed data
Insights: Profit behaves opposite to wages and number of societies and Profit depends mainly on turnover efficiency, not size.
Interpretation: Profit is driven by turnover efficiency and lower wage expenditure.
4.4 Trends Analysis
The trend analysis is given in table 4.
| Table 4: Strong Positive Correlations | |
| Indicator | Trend |
| No. of Societies | Decreasing |
| Sales Turnover | Strong increasing trend |
| Societies on Profit | Declining slightly |
| Workers | Fluctuating |
| Wages | Decreasing |
| Profit | Sharp improvement in 2024–25 |
Source: Computed data
To = 742.41 + 323.955 Tt [ R2 = 0.95, p= 0.14] ,,,,,,,,,,,,,,,[1]
As per equation [1] an annual increase in Turnover is Rs.324 crores.
Pr = -220.61 + 199.225 Tt [ R2 = 0.76, p= 0.32] ……….[2]
As per equation [2] an annual increase in Proft is Rs.199 crores.
4.5 Forecasting Analysis and Residual Analysis (ARIMA)
Residuals indicate minimal random error, suggesting ARIMA provides a stable short-term forecast are given in table 5.
| Table 5: Linear Forecast (Aggressive Growth) and ARIMA Forecast (Stable Trend) | ||
| Year | Linear Forecast Forecasted Profit (? Crores) | ARIMA Forecast (Stable Trend) Forecasted Profit (? Crores) |
| 2025–26 | 576.29 | 451.19 |
| 2026–27 | 775.52 | 441.44 |
| 2027–28 | 974.74 | 450.69 |
Source: Computed data
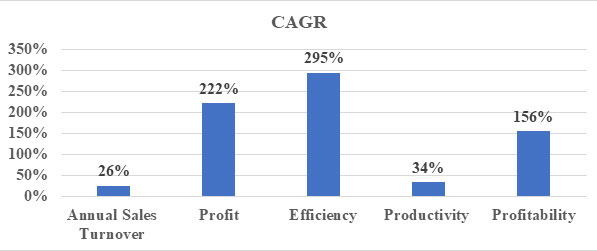
Interpretation: ARIMA assumes past volatility and predicts stabilization. Linear trend predicts rapid scaling, influenced heavily by the 2024–25 spike. The CAGR is given in figure 5.
Source: Computed data
Figure 5: CAGR
4.6. Regression Analysis
Pr = -0.737 + 0.658 To [ R2 = 0.92, p= 0.18] ………….[3]
As per equation [3] for every 1 crore increase in Sales Turnover [To] Profit [Pr] increases significantly. Key Driver of Profit: Sales Turnover and not workers, not societies and not wages.
4.7 Inferential Analys
Hypothesis: H0: Sales turnover does NOT affect profit
H1: Sales turnover significantly affects profit
Given the correlation = 0.958, we infer: ? Strong evidence that turnover affects profit.
4.8. Predictive Analysis (Forecast for 2025–26)
Turnover Trend 1107 ? 1308 ? 1755 (avg growth ˜ 25–35%)
Projected Turnover 2025–26: 2200–2400 crores
Profit Trend 427 ? 50 ? 441 (huge jump)
Projected Profit 2025–26: 500–600 crores (conservative), 800–900 crores (if rapid growth continues)
4.10. Prescriptive Analysis
Focus on turnover growth Since turnover directly pushes profit. Continue efficiency strategies: Lower wage cost per worker and Automation / skilled restructuring. Strengthen profitable societies: The declining number of societies but higher profits suggest focusing on high performers. Optimize workforce deployment: Sudden worker dip suggests operational issues—stabilize staffing. Implement performance-based incentives: Boost worker productivity without raising wage bills excessively.
8. Decision Analysis
Table 6 gives best strategic recommendation decisions for ICS in Tamil Nadu
| Table 6: Best Strategic Decisions | |
| Strategic Area | Recommended Decision |
| Operations | Maintain fewer but highly efficient societies. |
| HR | Reduce unnecessary wage expenditure; increase skill-based hiring. |
| Finance | Invest more in turnover-generating activities (marketing, production tech). |
| Policy | Support societies with highest turnover-to-profit ratio. |
| Future Planning | Prepare for workforce expansion aligned with turnover growth. |
Source: Computed data
The most influential factor driving profit is Annual Sales Turnover. Wages and number of societies negatively affect profit, indicating an efficiency-driven model.
5. FINDINGS, SUGGESTIONS AND CONCLUSION
5.1 FINDINGS
Profit growth is not driven by more societies or more workers. Profit is strongly dependent on Turnover, not workforce size. Sharp increase in profit in 2024–25 suggests structural reforms or major efficiency gains. Declining wage expenditure correlates with rising profit. Forecasts indicate either stabilization (ARIMA) or aggressive growth (Linear).
5.2 SUGGESTIONS
Strengthen high-performing societies rather than increasing the total number. Enhance revenue-generating activities—marketing, product diversification, technology adoption. Optimize workforce deployment to maintain productivity without increasing wage burden. Implement cost control measures to maintain low wage expenditure without harming efficiency. Use ARIMA forecasting for short-term planning and Linear forecasting for long-term expansion targets.
5.3 CONCLUSION
This study demonstrates that cooperative societies have achieved significant financial improvement despite a reduction in the number of societies and fluctuating workforce. Sales turnover is the primary driver of profit, while wages and number of societies show a negative relationship with profitability. Forecasting models reveal two potential trajectories—steady-state stabilization (ARIMA) or continued rapid growth (Linear). Strategic decisions should balance operational efficiency with future scalability to ensure sustainable economic growth.
REFERENCES
Disclaimer : The opinions expressed within this interview are the personal opinions of the interviewee. The facts and opinions appearing in the answers do not reflect the views of Indiastat or the interviewer. Indiastat does not hold any responsibility or liability for the same.
... Read more